Financial statements contain a lot of data. Simply reviewing an Income Statement or Balance Sheet often makes it hard to identify trends over time or compare companies of different sizes. That’s why vertical and horizontal analyses are essential. These methods help users interpret financial information clearly and make meaningful comparisons.
Owners, creditors, and investors gain insights by comparing financial data across multiple periods. For instance, you might analyze Accounts Receivable over three years or compare one company’s records with others in the same industry. Normal values in one industry may appear unusual in another, making context critical.
Businesses that can’t meet debt obligations often struggle to secure credit. Similarly, companies with below-average net earnings may find it difficult to attract investors. To avoid these pitfalls, analysts rely on tools such as vertical and horizontal analyses. This page focuses on four types of financial statement analysis:
• Vertical Analysis – Income Statement
• Vertical Analysis – Balance Sheet
• Horizontal Analysis – Income Statement
• Horizontal Analysis – Balance Sheet
You can download the incomplete Income and Balance sheets to practice on. download Income and Balance Sheets
Vertical Analysis
Vertical analysis focuses on one period at a time—such as a quarter or year—and expresses each item as a percentage of a base figure. This approach makes it easier to identify internal relationships within a single period, and then compare similar periods across multiple years.
Vertical Analysis for an Income Statement ↑
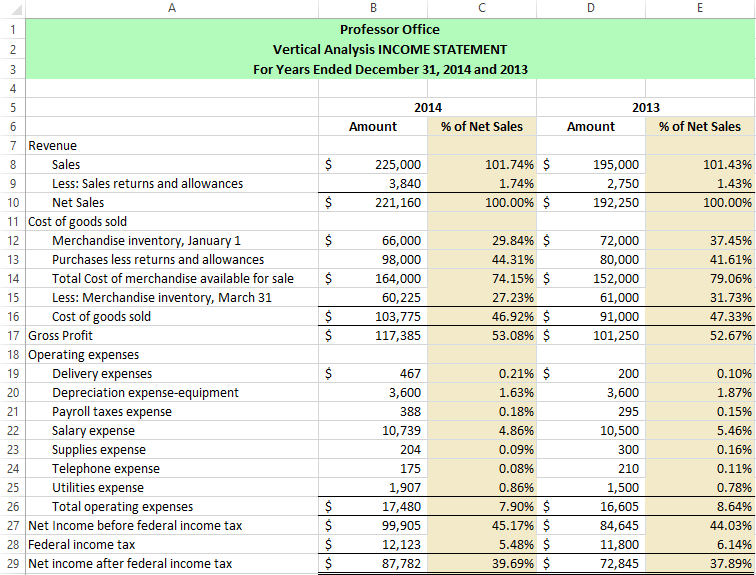
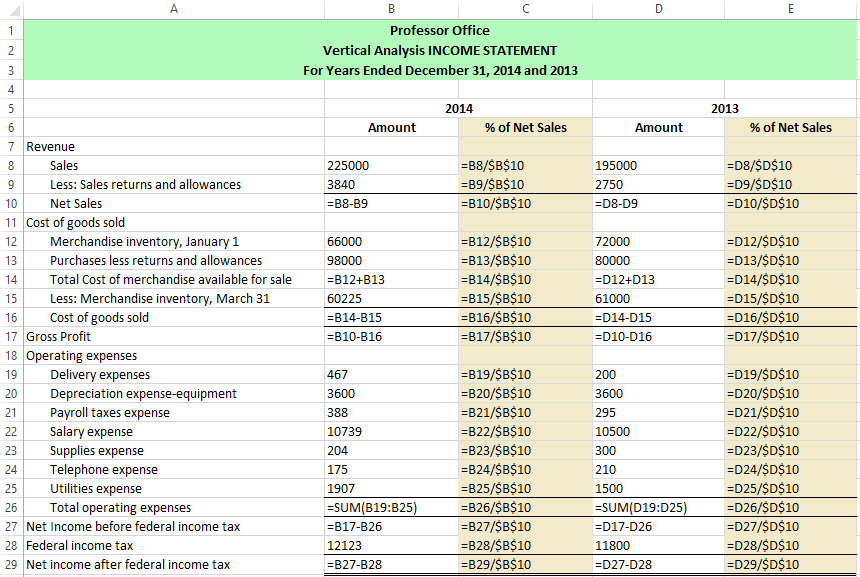
Analysts usually base vertical analysis of the Income Statement on Net Sales. First, divide Net Sales by itself to get 100%. Then, divide every other item on the statement by Net Sales. This method reveals how much of the total revenue each expense or income item represents.
The next image shows the specific formulas used in the analysis:
Vertical Analysis of Balance Sheet ↑
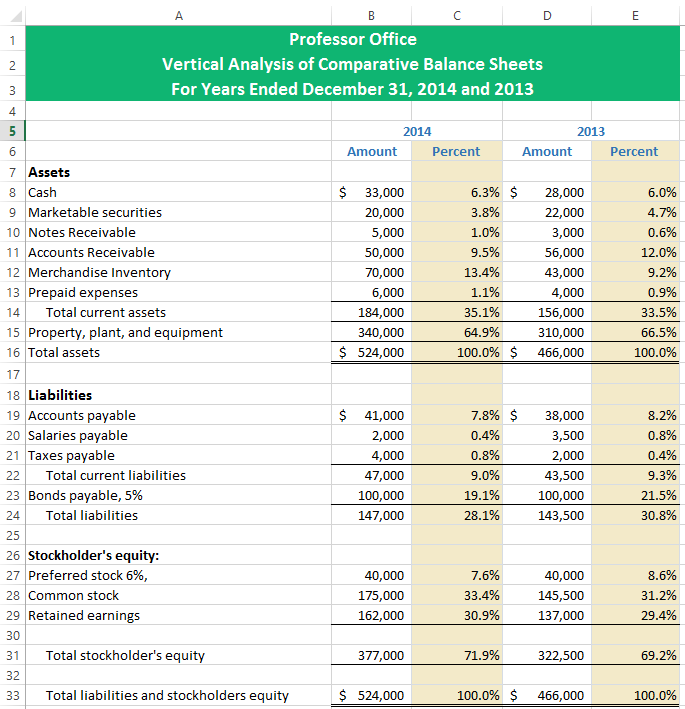
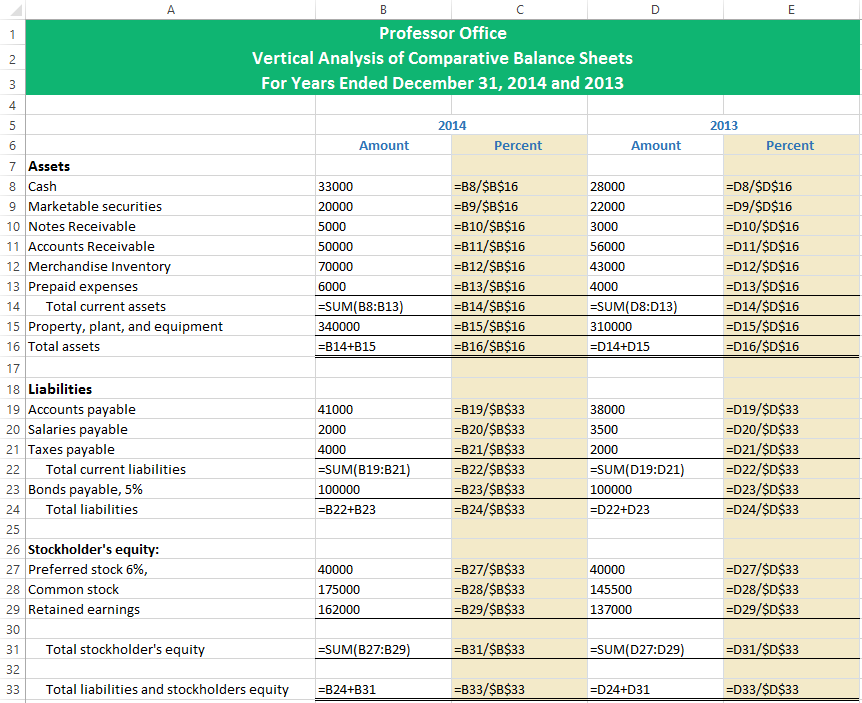
In a Balance Sheet vertical analysis, total assets serve as the base for all asset accounts. Meanwhile, total liabilities and equity form the base for analyzing the other side of the sheet. Each line item is expressed as a percentage of its respective total.
Here’s a breakdown of the formulas used:
Horizontal Analysis
Unlike vertical analysis, horizontal analysis tracks financial changes over time. It highlights dollar and percentage changes from one period to another, making it easier to detect trends.
Horizontal Analysis for an Income Statement ↑
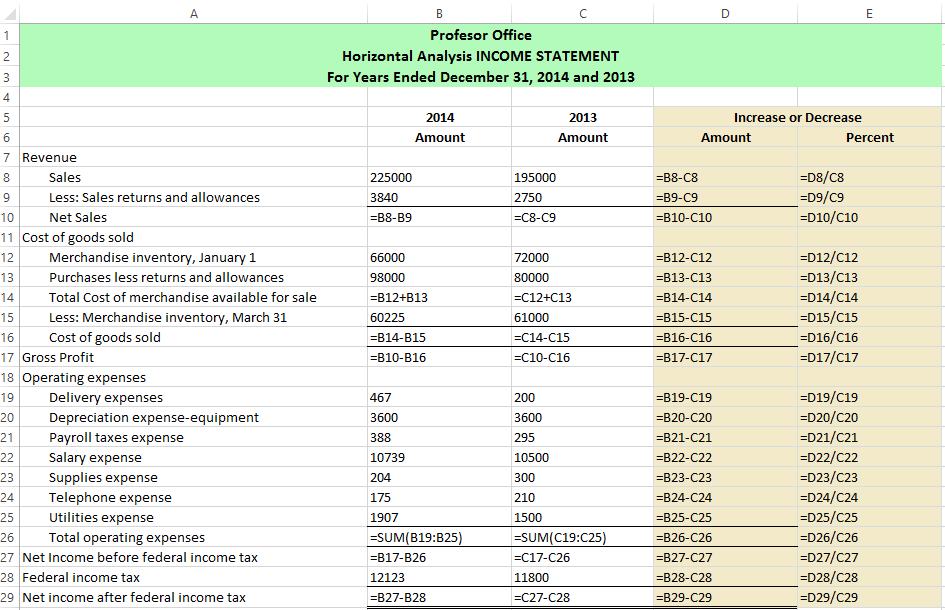
The most common format for horizontal analysis involves showing the dollar difference and percentage change between years. To find the percentage, divide the change in an item by its value in the base year.
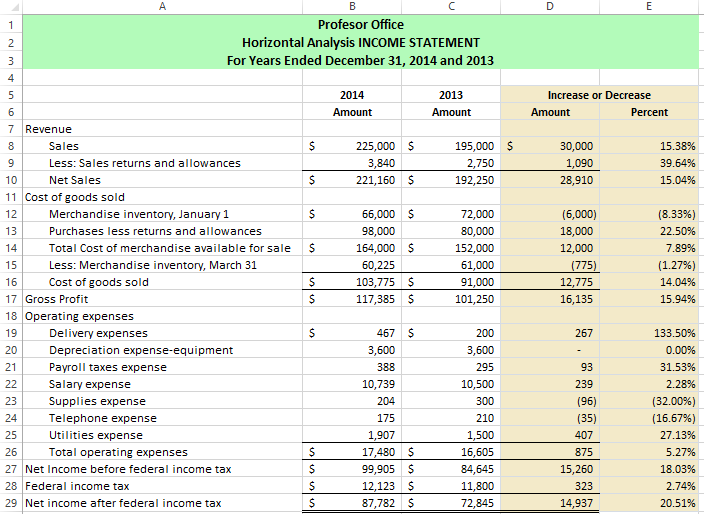
Here are the formulas used in the comparison:
Horizontal Analysis of Balance Sheet ↑
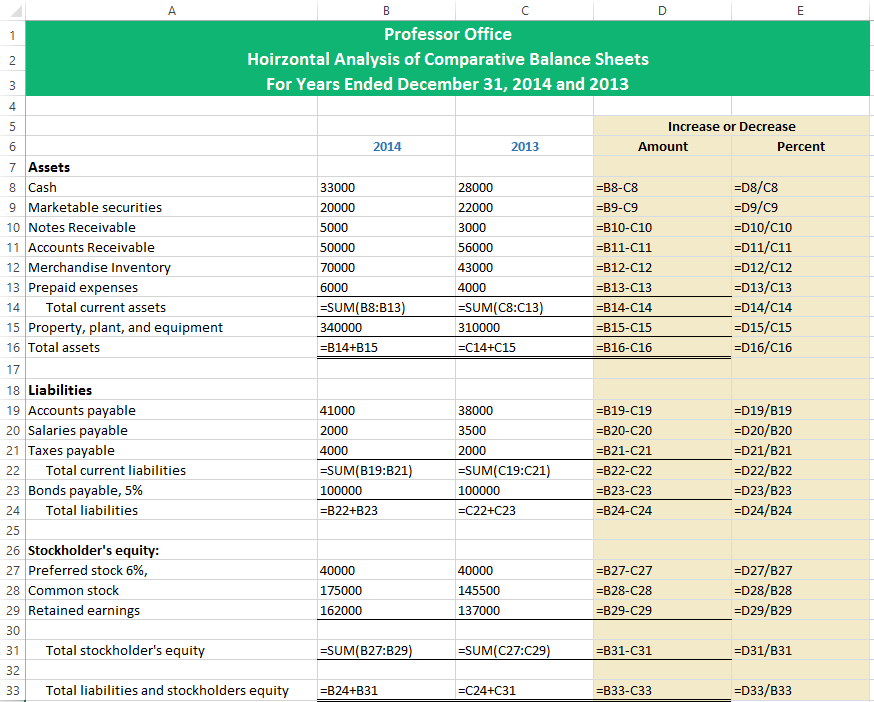
The Balance Sheet horizontal analysis follows the same format. Each item shows its change in both dollar and percentage terms when compared to the base year.

Below are the formulas used to calculate the changes:
