Looking to master Excel? Our comprehensive video library of Excel Tutorials covers everything from basic formulas to advanced automation.
Explore More Video Tutorial Collections:
Excel Chart Videos | Accounting| Educational Self Quiz Videos | Screen Saver and Slide Show Videos | Video Editing Tutorials
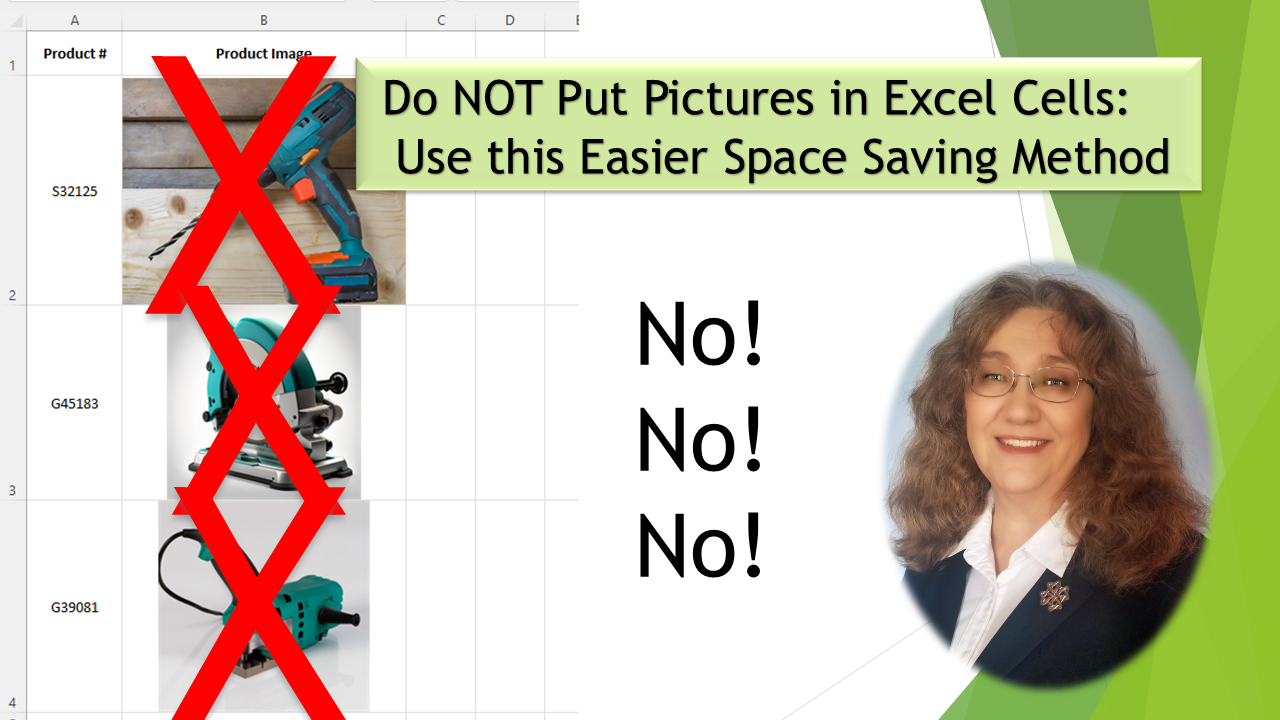
Add Pictures to Excel: No Cell Adjusting Needed
Ultimate Guide to Adding Pictures to Excel.
Learn the amazing unknown way to add pictures to Excel without the hassle of adjusting cells. Insert pictures into Notes. With this quick and easy method, you can hide and show pictures whenever you want, without taking up any cell space. Say goodbye to the impracticality of Excel’s built-in image feature and embrace this more practical solution.

Excel Tutorial – Camera Tool
This Excel tutorial shows you how to add the secret Excel Camera Tool to your Quick Access Toolbar or Ribbon. Combine text, charts, graphics, WordArt, SmartArt, data, etc. to create a picture that you can use in your presentations, videos, slide shows, other programs and so on.
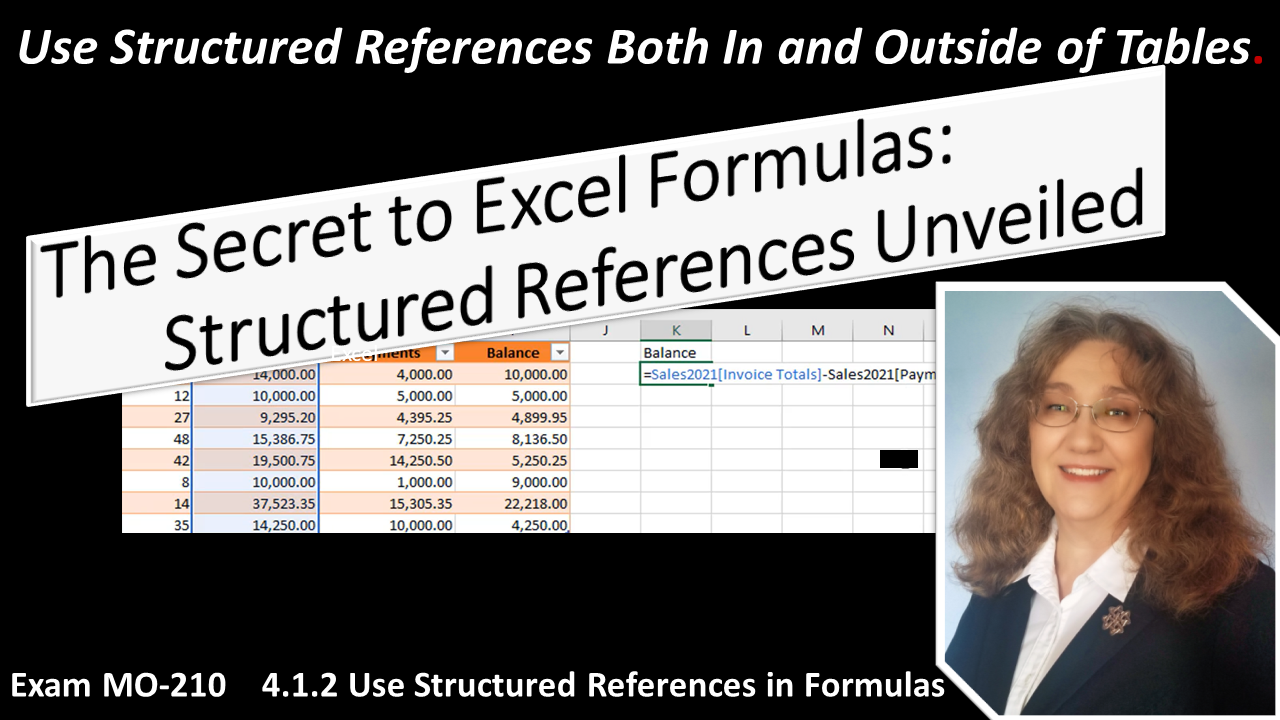
Excel Tutorials – Structured References
Excel tutorial on Structured References both in tables and out of tables. Use Structured Reference to perform math functions on multiple tables. Use Excel Structures to copy all or part of a table. Learn how to use Structured References to copy a portion of a table such as a row, column, headers, totals, etc.

Excel Tutorial – SUMIFS In-Depth
Excel Tutorials on mastering SUMIFS in Excel: The Ultimate Comprehensive Tutorial for Data Analysis! Unlock the full power of Excel’s SUMIFS function with this complete, step-by-step guide designed for beginners to advanced users. Whether you’re in finance, sales, marketing, or business analytics, this tutorial will transform how you analyze data.

Excel Tutorial on Navigation Pane
In-depth tutorial on using the Navigation Pane! See what elements exist within the workbook such as tables, charts, PivotTables, pictures ranges, slicers, grouped elements, etc. and navigate directly to those elements. You can select any object in the workbook by just clicking on it in the pane. Show hidden worksheets. Learn how to quickly navigate between different sections of your workbook, how to quickly access specific elements by applying filters and group and ungroup elements. The Navigation pane also makes it easier for those with visual impairments to access all parts of the workbook.
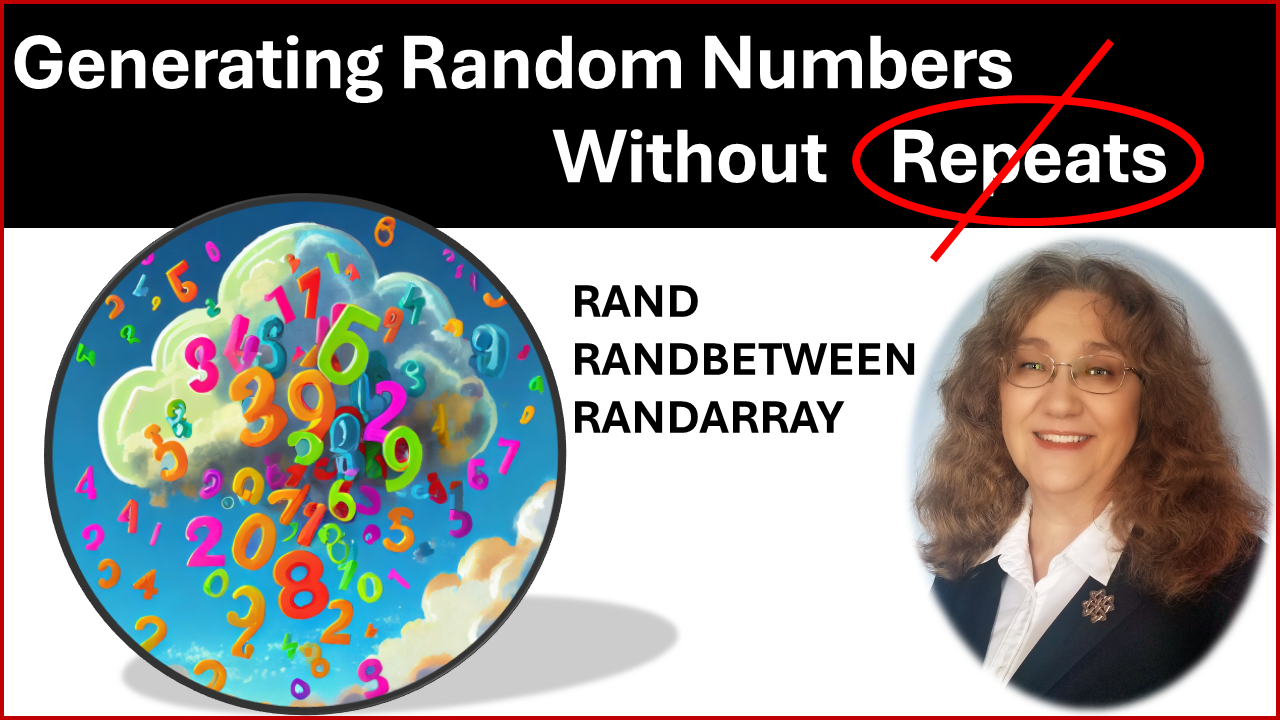
Generate Random Numbers in Excel
Excel tutorial on creating random values with three different functions. Learn how to handle duplicate values and use random values to select items from a list. Invaluable for saving substantial time during the testing of Excel features and functions, allowing for the swift creation of sample data. Get the benefit of creating arbitrary selections of items or individuals. Use it to randomly select employees for drug testing or items from the production line for quality assurance testing.
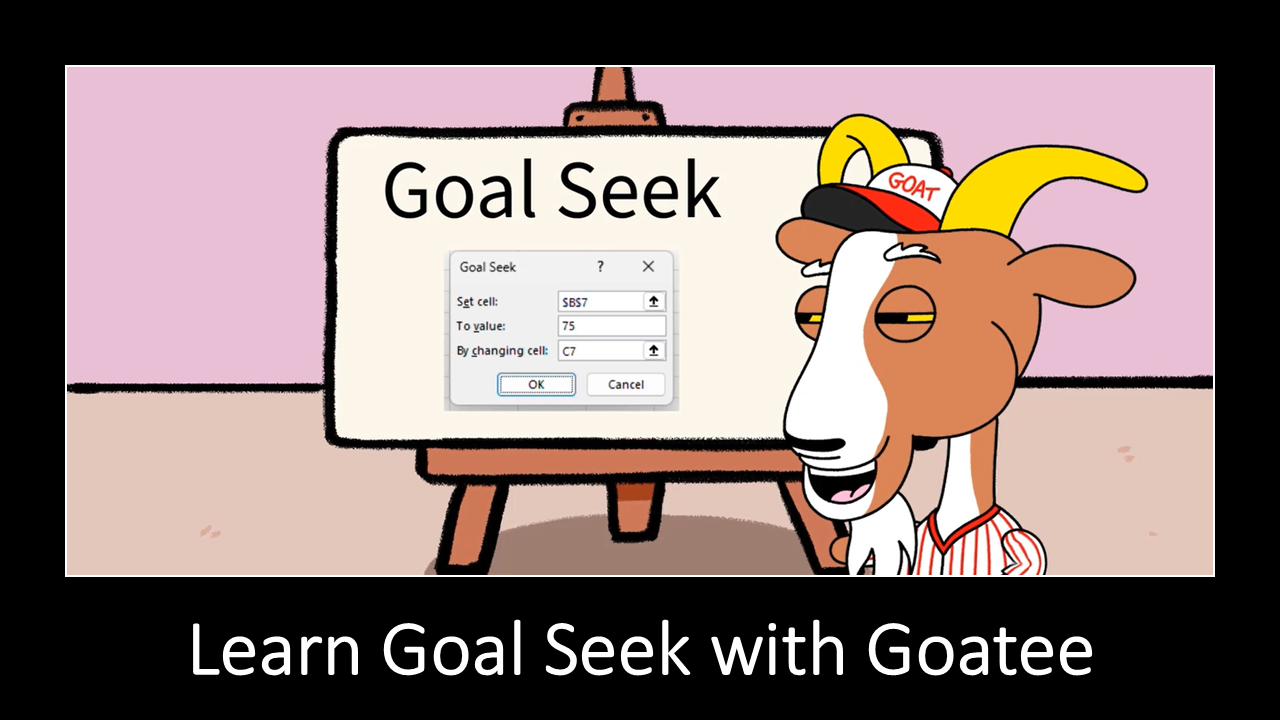
Excel Tutorial on Excel Goal Seek
Use Excel’s Goal Seek to solve for any unknown value by specifying a desired outcome. With Goal Seek, you can determine the input needed to achieve a specific result. Whether it’s finding the necessary sales figure to reach a target profit or determining the interest rate required to pay off a loan within a certain period, Goal Seek can help solve these problems quickly and efficiently. It can also solve Algebra problems.

Advantages of Excel Advanced Filtering
Everything you need to know about Excel Advanced Filtering in this comprehensive tutorial. In this Mastery series we will dive deep into one of the most powerful yet underutilized features in Excel. You will learn how to filter complex criteria, display only unique records, copy filtered data, dynamically adjust filters based on your needs and much more. Become a filter and data analysis expert.
How to use Stock Data Type for Stock Analysis
Learn how to enhance your stock analysis using Excel. This tutorial covers stock data types, current data, historical data, and more for in-depth analysis. How to use stock history function in Excel.
How to use Geography Data Type in Excel
Unlock the full potential of Excel with the Geography Data Type! In this step-by-step Excel tutorial, we’ll show you how to analyze locations like cities, counties, states, and countries using built-in Excel features. Learn how to convert simple text into geographic data, extract valuable information such as population, area, and GDP, and create interactive reports with just a few clicks. Whether you’re a beginner or an Excel pro, this video is perfect for anyone looking to enhance their data analysis skills.

Excel Tutorial on Creating Your First Macro
Excel Tutorial on how to Create Macros in Excel | Complete Beginner’s Guide Learn how to delete macros, change shortcut keys, and even attach macros to the Quick Access Toolbar or shapes and icons for fast access. This guide will teach you how to create macros in Excel, save workbooks with macros, and manage your personal workbook macros. Perfect for beginners, this video covers everything you need to start automating your tasks and boosting productivity in Excel!

What Relative Cell Addressing can do for You
Mastering Excel Macros: Fixing Absolute Cell Referencing Issues with VBA Code.
In this tutorial, we explore one of the most common problems when creating Excel macros – the use of Absolute Cell Referencing. While Excel defaults to absolute references in macros, this can cause issues when applying the macro to multiple cells. We’ll show you why Relative Cell Addressing is the better option for dynamic macros, and how to easily switch between the two.
You’ll also learn how to view and edit the VBA code behind your macros, gaining control over your automation. We guide you step-by-step in modifying a macro from Absolute to Relative references.

House Affordability Calculator
Curious about how to calculate the dream house for your budget? Watch this video to learn Excel formulas that will let you consider all variables to determine how much house you can afford.

Using Scenario Manager in Excel -Plan for Any Situation
Scenario analysis allows you to analyze multiple potential outcomes—such as best-case, most-likely case, and worst-case scenarios—and their impact on your business. Since the future is unpredictable, leveraging tools like Scenario Manager helps businesses anticipate challenges, optimize strategies, and prepare for uncertainties. With Excel Scenario Manager, you can easily input variables, explore different possibilities, and visualize how external factors like market conditions, economic changes, or unexpected disruptions might influence your bottom line. This feature is essential for creating flexible financial models, strategic forecasts, and data-driven contingency plans.

Excel Text Functions TEXTBEFORE, TEXTAFTER & TEXTSPLIT
Master Excel’s powerful text manipulation functions in this comprehensive tutorial! Learn how to use TEXTBEFORE, TEXTAFTER, and TEXTSPLIT like a pro with real-world examples. Discover advanced techniques for extracting data between delimiters, handling multiple separators, and transforming your data with precision.
Excel RANK Functions Made Easy: RANK.EQ, RANK.AVG & Advanced Ranking Techniques
🎯 In this tutorial, you’ll learn:
• How to use RANK.EQ vs RANK.AVG – understand the key differences
• Creating rankings within specific groups or categories • Using custom symbols for visual ranking representation
• Implementing rolling ranks for dynamic data • Tracking and analyzing ranking changes over time
• Practical examples with real-world applications
Perfect for Excel users looking to advance from beginner to intermediate level. Whether you’re tracking sales performance, student grades, or competitive rankings, these techniques will help you analyze your data more effectively.
