Financial statement analysis is essential for understanding business performance, identifying trends, and making informed investment decisions. Whether you’re analyzing an income statement or balance sheet, vertical and horizontal analysis methods transform raw financial data into actionable insights. This comprehensive guide teaches you how to perform common size analysis, trend analysis, and comparative financial statement analysis using proven techniques.
Owners, creditors, and investors gain competitive advantages by comparing financial data across multiple periods and against industry benchmarks. For instance, analyzing accounts receivable trends over three years reveals collection efficiency, while comparing profit margins across companies helps identify market leaders. Understanding these financial analysis techniques is crucial for evaluating company performance, creditworthiness, and investment potential.
Businesses that can’t meet debt obligations struggle to secure credit and may face bankruptcy. Companies with below-average net earnings find it difficult to attract investors and grow market share. To avoid these pitfalls and maximize financial performance, analysts rely on systematic approaches including vertical analysis (common size statements) and horizontal analysis (trend analysis). This page provides everything you need to master financial statement analysis:
Table of Contents
Vertical Analysis – Income Statement Vertical Analysis – Balance Sheet Horizontal Analysis – Income Statement Horizontal Analysis – Balance Sheet How to Interpret Vertical Analysis Results How to Interpret Horizontal Analysis Results Red Flags in Financial Statement Analysis Industry Benchmarks and Comparative Analysis Frequently Asked Questions Interactive Financial Analysis Practice GameDownload Practice Income and Balance Sheets (Excel)
Understanding Vertical Analysis (Common Size Analysis)
Vertical analysis, also known as common size analysis, focuses on one accounting period and expresses each line item as a percentage of a base figure. This financial analysis method eliminates the size effect, allowing you to compare companies of vastly different sizes or analyze internal cost structures. By converting dollar amounts to percentages, vertical analysis reveals the relative weight of each component within a financial statement.
Vertical Analysis for an Income Statement
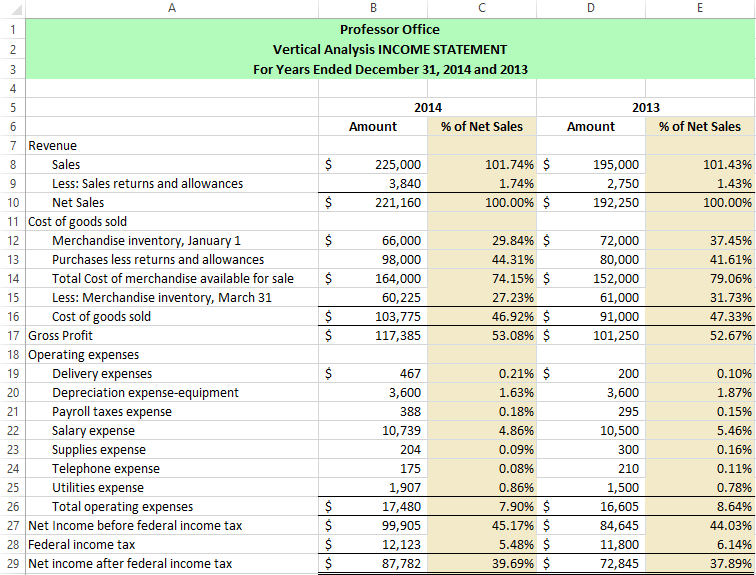
↑Income statement vertical analysis uses net sales (revenue) as the base figure, which equals 100%. Every other line item—cost of goods sold, operating expenses, net income—is divided by net sales to show what percentage of revenue it represents. This common size income statement format reveals profit margins, expense ratios, and cost structure efficiency at a glance.
To perform vertical analysis on an income statement, follow these steps: (1) Set net sales as 100% by dividing net sales by itself, (2) Divide each expense category by net sales, (3) Divide operating income by net sales to find operating margin, (4) Divide net income by net sales to calculate net profit margin. The resulting percentages show how efficiently a company converts revenue into profit.
The next image shows the specific Excel formulas used in vertical analysis of income statements:

Vertical Analysis of Balance Sheet
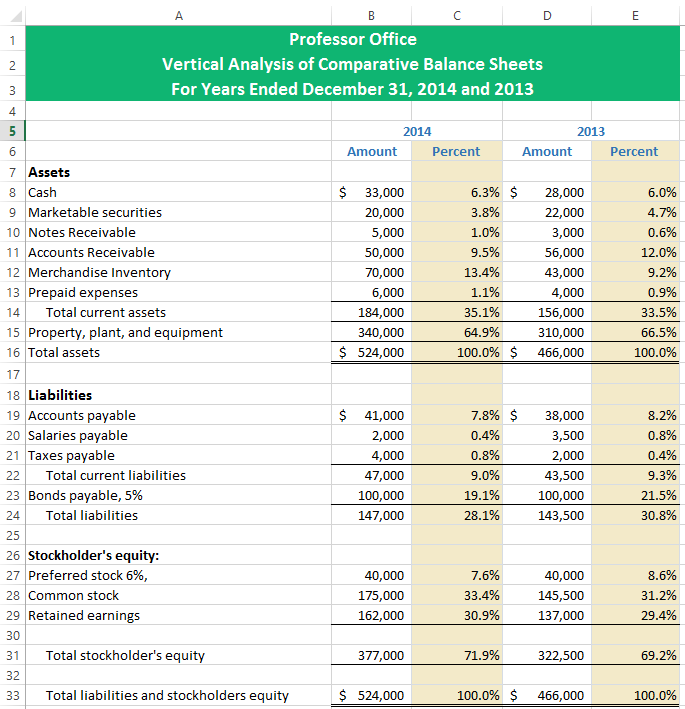
↑Balance sheet vertical analysis uses total assets as the base (100%) for all asset accounts, while total liabilities and equity combined serve as the base for the right side of the balance sheet. This common size balance sheet reveals asset composition, capital structure, and financial leverage. Each line item percentage shows its proportion of the company’s total resources or total financing.
The vertical analysis process for balance sheets includes: (1) Express each asset as a percentage of total assets to see asset allocation, (2) Express each liability as a percentage of total liabilities and equity to understand financing sources, (3) Calculate equity percentage to determine ownership stake versus debt financing. This analysis highlights whether a company relies heavily on debt financing (high leverage) or equity financing (conservative capital structure).
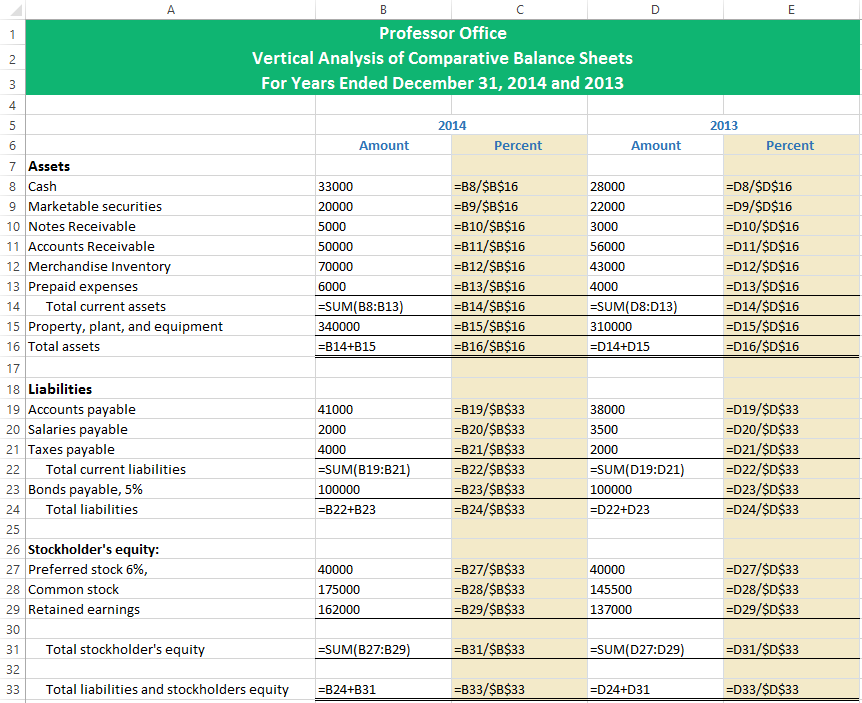
Here’s a breakdown of the Excel formulas used in balance sheet vertical analysis:
Understanding Horizontal Analysis (Trend Analysis)
Horizontal analysis, also called trend analysis or comparative analysis, tracks financial statement changes over multiple time periods. Instead of looking at one period in isolation, horizontal analysis shows dollar changes and percentage changes from a base year, revealing growth trends, declining performance, or cyclical patterns. This time-series analysis is crucial for identifying whether a company is growing, stagnating, or declining.
Horizontal Analysis for an Income Statement
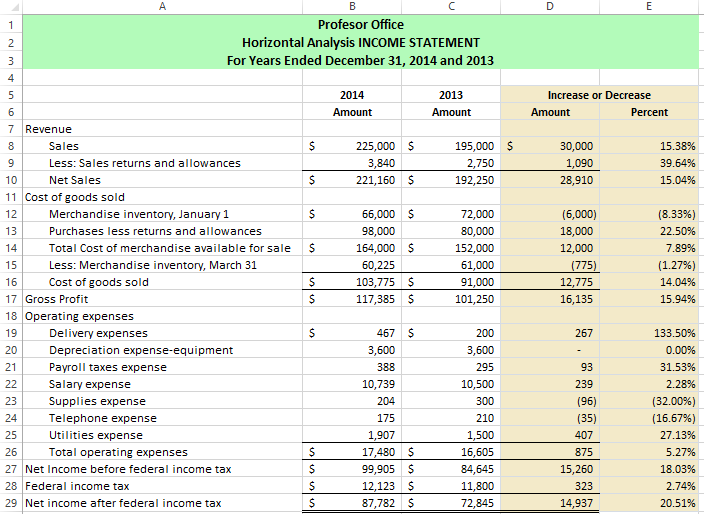
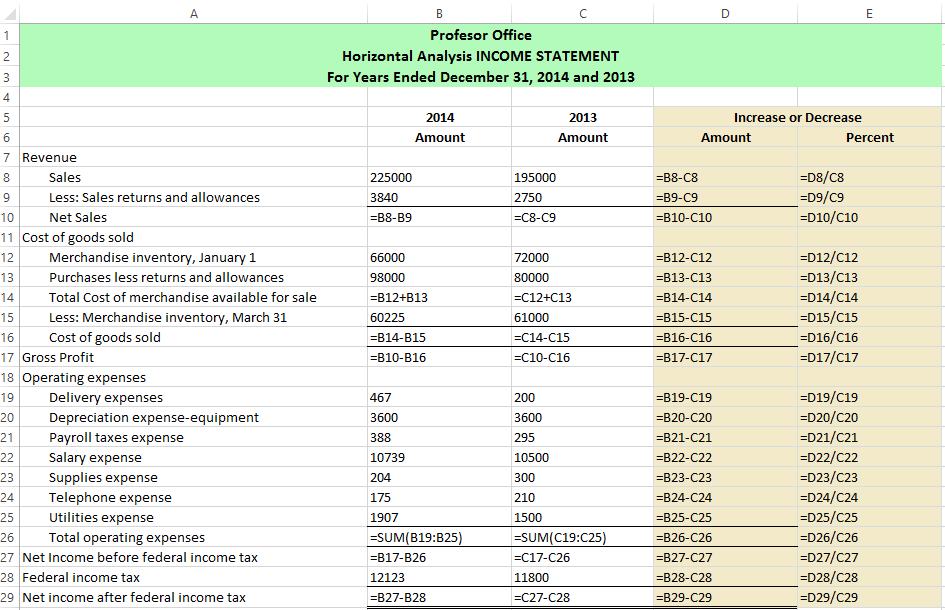
↑Income statement horizontal analysis compares financial performance across years by calculating both dollar changes and percentage changes for each line item. The most common format shows three columns: base year amount, current year amount, dollar change, and percentage change. To calculate percentage change, divide the dollar change by the base year amount and multiply by 100.
This trend analysis reveals critical patterns: Is revenue growing faster than expenses? Are profit margins expanding or contracting? Is the company achieving economies of scale? For example, if revenue increases 20% but cost of goods sold increases 25%, the company is experiencing margin compression—a significant warning sign for investors.
Here are the Excel formulas used in horizontal analysis of income statements:
Horizontal Analysis of Balance Sheet
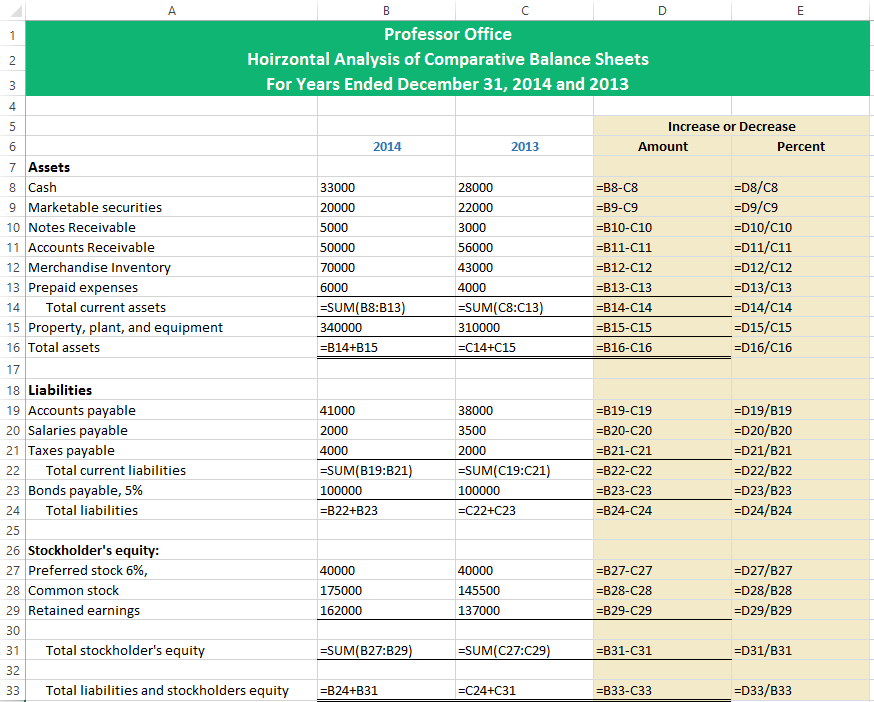
↑Balance sheet horizontal analysis follows the same comparative approach, showing how assets, liabilities, and equity change over time. This trend analysis reveals whether a company is accumulating assets, increasing debt, retaining earnings, or distributing profits to shareholders. Key metrics include asset growth rate, debt accumulation, and equity changes.
Watch for these patterns in balance sheet horizontal analysis: Rapid inventory increases may signal slow-moving stock, growing accounts receivable relative to sales suggests collection problems, and increasing long-term debt without corresponding asset growth raises solvency concerns. These trends often predict future financial distress before it appears in income statements.

Below are the Excel formulas used to calculate balance sheet horizontal analysis:
How to Interpret Vertical Analysis Results
↑Interpreting vertical analysis requires understanding industry norms and business models. A common size income statement reveals whether a company operates efficiently compared to competitors. Here’s what to look for when analyzing vertical analysis results:
Income Statement Vertical Analysis Interpretation
Gross Profit Margin: This percentage (Gross Profit ÷ Net Sales) shows how much revenue remains after direct production costs. Retail businesses typically show 25-40% gross margins, while software companies often exceed 70%. Declining gross margins suggest pricing pressure, rising input costs, or unfavorable product mix shifts. Compare your company’s gross margin to industry averages to assess competitive positioning.
Operating Expense Ratio: Operating expenses as a percentage of sales reveal cost control effectiveness. If operating expenses consume 30% of revenue while competitors average 20%, the company faces efficiency problems. Break down operating expenses further: Are selling expenses too high? Is R&D spending appropriate for the industry? Do administrative costs suggest bloat?
Net Profit Margin: The bottom line percentage (Net Income ÷ Net Sales) summarizes overall profitability. Grocery stores operate on 1-3% net margins, while pharmaceutical companies may achieve 15-25%. A net margin below industry average signals competitive disadvantage, operational inefficiency, or excessive debt burden (high interest expense).
Balance Sheet Vertical Analysis Interpretation
Current Assets Percentage: Current assets as a percentage of total assets indicate liquidity and operational efficiency. Manufacturing companies typically hold 40-60% in current assets, while capital-intensive utilities may show only 20-30%. High current asset percentages suggest strong liquidity but potentially underutilized resources.
Debt Ratio: Total liabilities as a percentage of total assets (the debt ratio) measures financial leverage. Conservative companies maintain debt ratios below 50%, while aggressive growth companies may exceed 70%. High debt ratios increase financial risk but can boost return on equity during good times. Compare debt ratios to industry norms and the company’s ability to service debt.
Equity Percentage: Stockholders’ equity as a percentage of total assets reveals ownership cushion. Higher equity percentages indicate conservative financing and stronger ability to weather economic downturns. However, very high equity percentages (above 80%) might suggest the company is under-leveraged and missing growth opportunities.
How to Interpret Horizontal Analysis Results
↑Horizontal analysis interpretation focuses on trend direction, magnitude, and consistency. Growing companies show positive percentage changes in revenue and assets, while declining companies show negative trends. But the real insights come from analyzing the relationships between different line items over time.
Income Statement Horizontal Analysis Interpretation
Revenue Growth Analysis: Consistent revenue growth (positive percentage changes year-over-year) indicates market acceptance, successful sales strategies, and business expansion. However, analyze the quality of revenue growth: Is it organic (more customers, higher prices) or through acquisitions? Is growth accelerating, stable, or decelerating? Decelerating revenue growth often predicts future problems before they impact earnings.
Expense Growth Relative to Revenue: The critical question in horizontal analysis is whether expenses grow faster or slower than revenue. If revenue increases 15% but operating expenses increase 25%, the company is becoming less efficient—profit margins will compress. Ideally, economies of scale should make expense growth slower than revenue growth, expanding margins over time.
Earnings Trend Analysis: Net income percentage changes reveal earnings quality and sustainability. Volatile earnings (large positive swings followed by large negative swings) suggest cyclical business, accounting manipulations, or one-time items. Steady, consistent earnings growth indicates sustainable competitive advantage and predictable business performance.
Balance Sheet Horizontal Analysis Interpretation
Asset Growth Patterns: Asset growth should roughly match revenue growth in most businesses. If assets grow 30% but revenue only grows 10%, the company is deploying capital inefficiently—return on assets is declining. Conversely, if revenue grows 20% with only 5% asset growth, the company is improving asset utilization (asset turnover is increasing).
Working Capital Trends: Analyze changes in current assets and current liabilities together. Growing accounts receivable might indicate sales growth (positive) or collection problems (negative). Rising inventory could mean expanding operations (positive) or slow-moving stock (negative). Compare these changes to revenue growth to determine whether they’re healthy or concerning.
Debt and Equity Trends: Track how the company finances growth. Increasing debt faster than equity raises leverage and financial risk. Declining equity while debt increases suggests the company is distributing earnings to shareholders rather than reinvesting—this may be appropriate for mature companies but dangerous for growth companies needing capital investment.
Red Flags in Financial Statement Analysis
↑Certain patterns in vertical and horizontal analysis signal potential financial distress, accounting manipulation, or unsustainable business models. Here are the most important warning signs to watch for:
Income Statement Red Flags
Declining Gross Margins: Falling gross profit percentages over multiple periods suggest the company is losing pricing power, facing rising costs it can’t pass to customers, or experiencing adverse product mix shifts. This trend almost always predicts future earnings problems.
Revenue Growth Without Earnings Growth: If horizontal analysis shows revenue increasing 20% but net income only increasing 5%, the company is experiencing margin compression. Something is going wrong—costs are rising, competition is intensifying, or the company is buying growth through price cuts.
Operating Expenses Growing Faster Than Revenue: This pattern indicates deteriorating operational efficiency. The company may be losing control over spending, experiencing diseconomies of scale, or facing structural cost increases (regulations, labor markets, etc.).
Balance Sheet Red Flags
Rapid Debt Accumulation: Debt growing much faster than assets or equity suggests the company is over-leveraged and may face solvency problems. Check whether debt service (interest payments) is consuming an increasing percentage of operating income.
Declining Cash Balances: If cash as a percentage of total assets drops significantly over time while debt increases, the company may be heading toward a liquidity crisis. Combine this analysis with cash flow statement review to understand whether operations generate cash or consume it.
Inventory or Receivables Growing Faster Than Sales: When horizontal analysis shows inventory or accounts receivable increasing 30% but sales only increasing 10%, problems are brewing. Excess inventory suggests demand weakness, while growing receivables indicate collection difficulties or aggressive revenue recognition.
Industry Benchmarks and Comparative Analysis
↑Financial ratios and percentages mean little without context. A 5% net profit margin might be excellent in grocery retail but terrible in software. Here’s how to use industry benchmarks effectively in your vertical and horizontal analysis:
Understanding Industry Differences
Asset-Intensive vs. Asset-Light Industries: Manufacturing and utilities require substantial fixed assets (property, plant, equipment), so fixed assets represent 60-80% of total assets in vertical analysis. Consulting and software companies operate asset-light models, with fixed assets often below 20% of total assets. Don’t compare vertically analyzed balance sheets across dramatically different business models.
High-Margin vs. Low-Margin Industries: Software companies typically show net profit margins of 15-30%, while retailers operate on 2-5% margins. What matters is not the absolute percentage but whether a company’s margins exceed its industry average. Use resources like CSIMarket, Morningstar, or industry trade associations to find relevant benchmarks.
Growth vs. Mature Industries: Technology and biotech companies in growth phases often show negative net income (losses) as they invest heavily in R&D and market expansion. Mature industries like utilities and consumer staples should show consistent profitability. Adjust your horizontal analysis interpretation based on industry life cycle stage.
Where to Find Industry Benchmarks
Public Company Databases: SEC EDGAR database provides financial statements for all public companies. Download competitors’ 10-K reports, perform your own vertical and horizontal analysis, and compare results. Focus on companies of similar size and business model.
Industry Associations: Trade groups often publish aggregate financial statistics for members. The National Retail Federation, National Association of Manufacturers, and similar organizations provide industry-specific benchmarks unavailable elsewhere.
Financial Data Services: Services like Bloomberg, FactSet, S&P Capital IQ, and IBISWorld provide pre-calculated industry averages, peer comparisons, and historical trends. While expensive, these services save enormous time and provide reliable benchmarks for professional analysis.
Frequently Asked Questions About Financial Statement Analysis
↑A: Vertical analysis (common size analysis) looks at one time period and expresses every line item as a percentage of a base figure—net sales for income statements, total assets for balance sheets. This allows comparison between companies of different sizes. Horizontal analysis (trend analysis) compares the same company across multiple time periods, calculating dollar and percentage changes to identify trends. Use vertical analysis for cross-company comparisons and horizontal analysis for tracking one company’s performance over time.
A: Yes! That’s exactly what vertical analysis is designed for. By converting all dollar amounts to percentages of a common base, vertical analysis eliminates size effects. A $10 million company and a $1 billion company can be meaningfully compared using common size income statements and balance sheets. However, make sure you’re comparing companies in the same industry with similar business models for relevant insights.
A: Most analysts use 3-5 years for horizontal analysis to identify meaningful trends while avoiding excessive complexity. Three years is the minimum to distinguish trends from one-time fluctuations. Five to ten years reveals long-term patterns, economic cycle effects, and strategic shifts. For publicly traded companies, 5-year analysis is standard. Avoid single-year comparisons—they can be misleading due to anomalies, accounting changes, or unusual economic conditions.
A: Choose a “normal” year as your base year—avoid years with unusual events, acquisitions, restructuring charges, or economic disruptions. The base year should represent typical operations. Many analysts use the earliest year in their analysis period as the base year, then calculate percentage changes for all subsequent years relative to that base. Some analysts recalculate each year as a percentage change from the immediately prior year (year-over-year analysis) rather than from a fixed base year.
A: Percentage change calculations become problematic when the base year amount is negative. If net income changes from -$100,000 (loss) to +$50,000 (profit), the percentage change is meaningless. In these cases, simply report the dollar change and note that the company moved from loss to profit. Alternatively, use absolute values for the percentage calculation, but clearly label the result as non-standard to avoid confusion.
A: Both! They provide complementary insights. Start with vertical analysis to understand the company’s current structure and compare it to competitors. Then perform horizontal analysis to identify trends over time. The combination reveals whether structural issues (evident in vertical analysis) are improving or worsening (evident in horizontal analysis). For example, vertical analysis might show operating expenses are 35% of sales versus a 25% industry average. Horizontal analysis then reveals whether that gap is widening or narrowing over time.
A: It depends entirely on the industry. Grocery stores operate on 20-25% gross margins, clothing retailers average 40-50%, software companies achieve 70-85%, and pharmaceutical companies often exceed 80%. What matters is whether a company’s gross margin exceeds its industry average and whether the margin is stable or improving over time. Use vertical analysis to compare your target company’s gross margin percentage to industry benchmarks.
A: Standard horizontal analysis uses nominal dollars (actual historical amounts), which can be misleading during high inflation periods. For inflation-adjusted horizontal analysis, convert all years to constant dollars using a price index (CPI or GDP deflator). Divide each year’s financial statement amounts by that year’s price index, then multiply by the current year index. This reveals real growth versus merely inflationary increases. Most basic horizontal analysis ignores inflation, but sophisticated analysis should adjust for it.
A: Yes, certain patterns raise red flags. Vertical analysis might show unusual expense ratios or asset compositions. Horizontal analysis might reveal erratic revenue recognition, sudden changes in accounting policies, or unsustainable growth rates. However, financial statement analysis alone cannot definitively prove fraud—it identifies areas requiring deeper investigation. Combine ratio analysis, cash flow analysis, and qualitative factors (management integrity, auditor opinions, related-party transactions) for comprehensive fraud detection.
A: For income statements, net profit margin (net income ÷ net sales) is the single most important percentage because it summarizes overall profitability after all expenses, taxes, and interest. For balance sheets, the debt ratio (total liabilities ÷ total assets) is crucial because it reveals financial leverage and solvency risk. However, comprehensive analysis requires examining multiple percentages—no single ratio tells the complete story.
Interactive Financial Analysis Practice Game
↑Test Your Knowledge: Vertical & Horizontal Analysis Challenge
Answer questions about financial statement analysis and improve your skills! This interactive quiz covers vertical analysis, horizontal analysis, and interpretation techniques.
Ready to Practice Your Skills?
Download the practice Excel workbook and apply what you’ve learned about vertical and horizontal analysis. Work through real financial statements and compare your results to the answer key.
Download Practice Workbook NowKey Takeaways for Financial Statement Analysis Success
Use vertical analysis to compare companies of different sizes and analyze internal cost structure by expressing everything as percentages.
Use horizontal analysis to identify trends, growth patterns, and performance changes over multiple periods.
Always compare results to industry benchmarks, competitors, and the company’s own historical performance for meaningful context.
Watch for red flags like declining margins, expenses growing faster than revenue, or receivables/inventory growing faster than sales.
Combine both methods for comprehensive analysis—vertical analysis shows the current structure while horizontal analysis reveals whether it’s improving or deteriorating.
